You should know that this isn't a GIS class, per say. It's about presenting your GIS maps to an audience. Still, you need to know how to use GIS and may not be familiar with QGIS.
This first week, the goal is to have current versions of QGIS installed and to familiarize you with some basic aspects of QGIS. We will walk through the process of creating a map like one produced in a high quality magazine, Adventure Cycling.
Steps include:
Assessing space, scale, audience, message, context, and need
Creating a working directory for your project
Mocking up a map by hand or in a graphics program
Selecting and importing data
Setting the project projection
Setting the composer window
Manipulating data
Styling data
Exporting data (for use in Adobe Illustrator)
Map Process
A map process checklist
Background
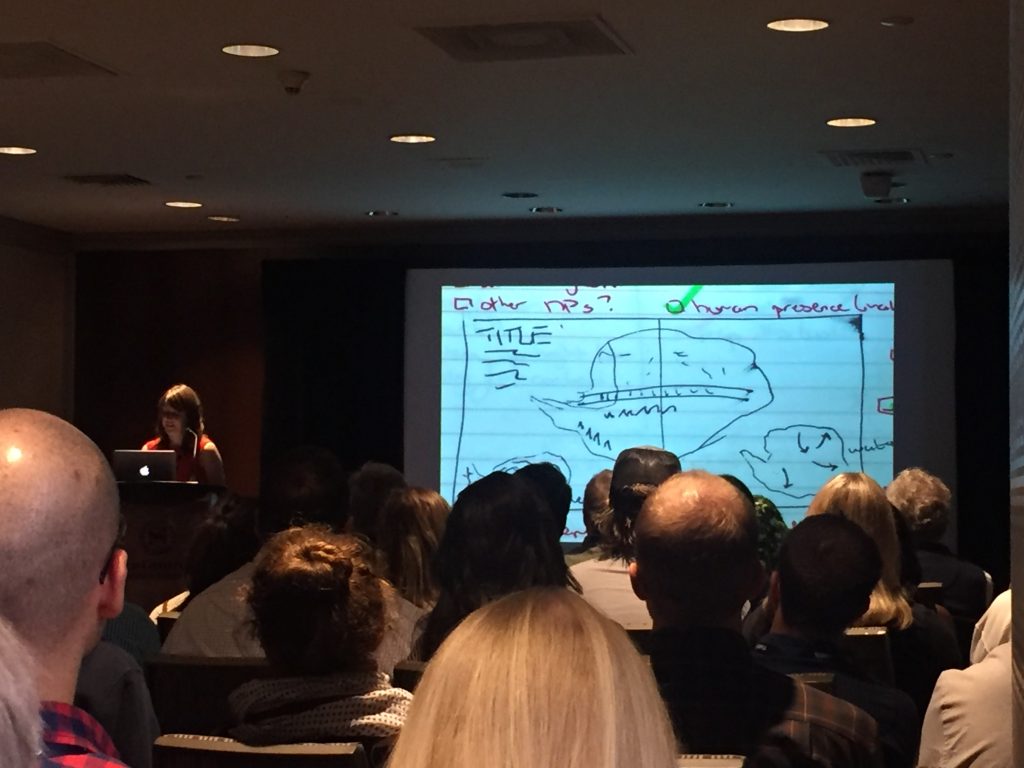
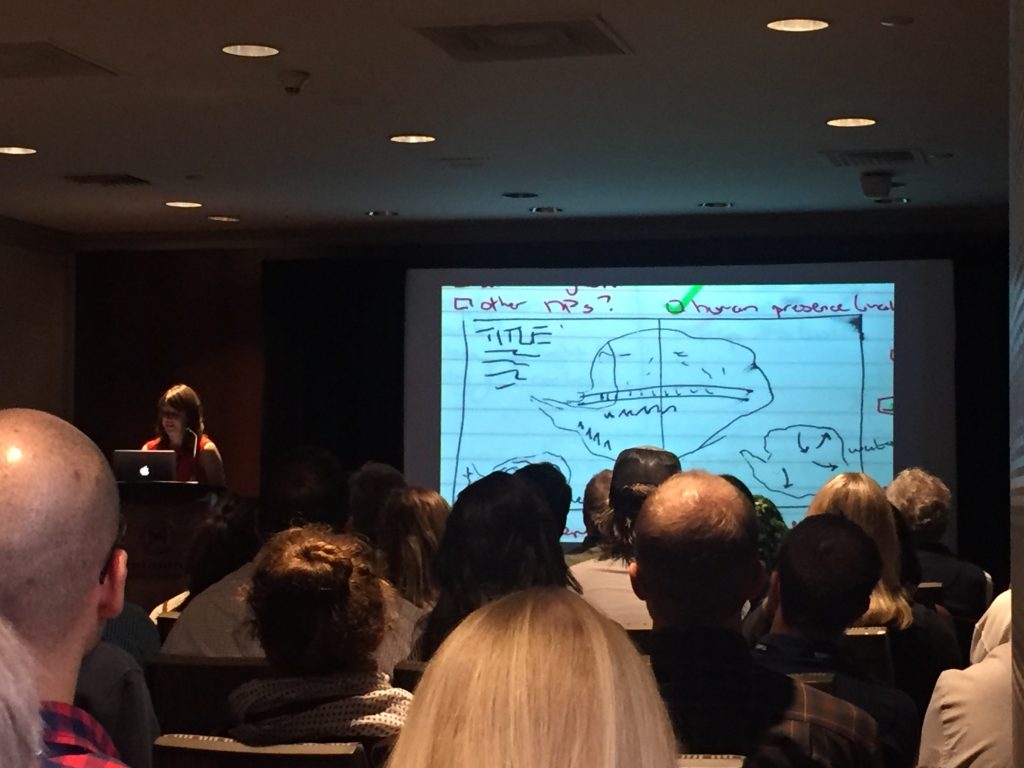
We have a lot of information available for making maps. This can be a good or bad thing. So that we don't deal with more information than we need, it helps to select information that serves our purpose and audience. What happens if we just start designing in GIS? For me, GIS is a good working environment to ask questions. But asking questions is different than communicating something to an audience. I want to use an iterative process and avoid extra work. To convey your message to an audience, it’s best to block out the info on the page. A map could be sketched on paper, like the Antartica map presented by Lauren Tierney at NACIS. Or a map can be blocked out in Adobe Illustrator, placing maps, text and graphics for reference. Sketching or blocking out gives you options. Mapping is iterative, and I want to shorten the iteration process if possible.
Lauren Tierney presents at NACIS about the double fold out map in National Geographic Magazine of Antartica. Here's the YouTube video of her presentation.
National Geographic Magazine's Cartography of Antarctica — Lauren Tierney
Space, scale, audience, message, context, need?
These are really important questions to ask at the beginning. Maybe we are working with a client. These are questions I ask. And the last question is particularly important because I personally don't want to make a map that won't serve it's intended audience.
What size do we have to work with?
What scale will convey our message?
What does our audience know about the topic?
What does our audience need to know in order to understand or take action?
Is our audience familiar with this part of the world?
How will the map get to the intended audience?
What’s the graphic context? i.e. page content, sign, web
Is there a map that already serves our purposes?
How will our audience benefit, respond or take action?
Is there a secondary audience?
Can we accomplish our goal given the size, scale, audience, and desired message?
Create a working directory for your project
Create the following directories, keeping QGIS files and a readme.txt in the project directory. The readme contains project notes. Instead of a readme, notes can be kept in Evernote a similar notebook.
Project directory
Vector Data
Downloaded data
SpatiaLite file
Raster Data
Downloaded data
Reprojected files
Reference
Downloaded pdfs
Specifications doc
Screen shots
Styles
Exports
Mockup and get a sense for scale
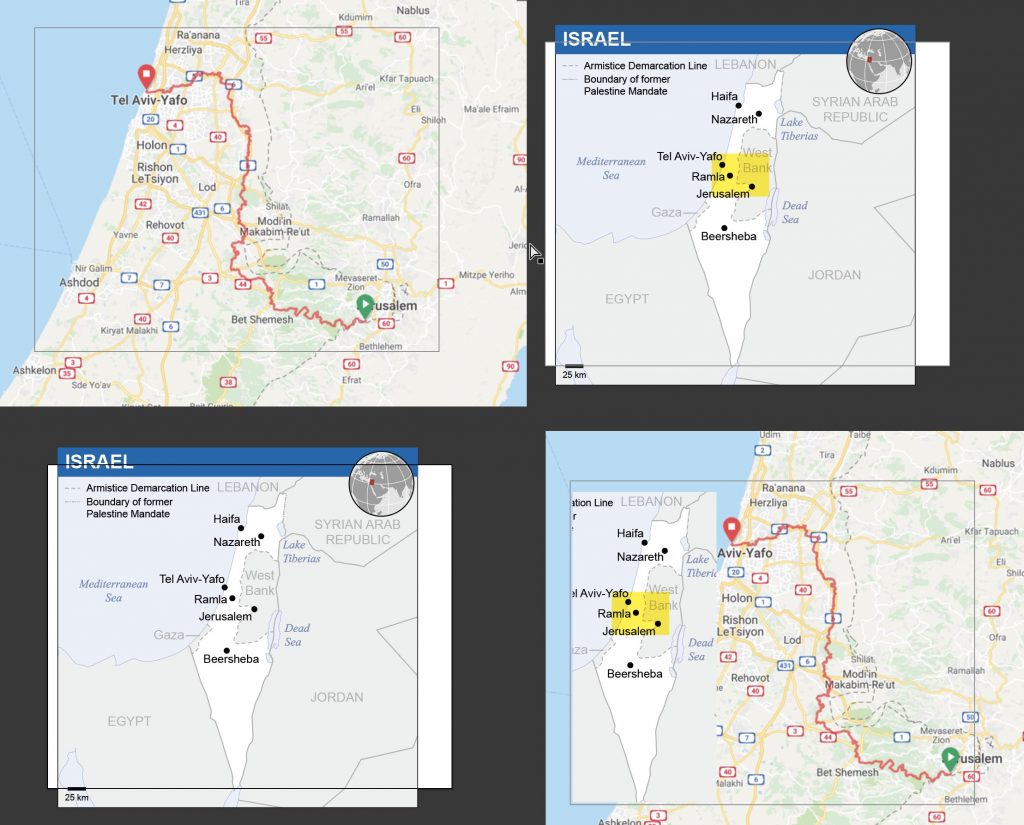
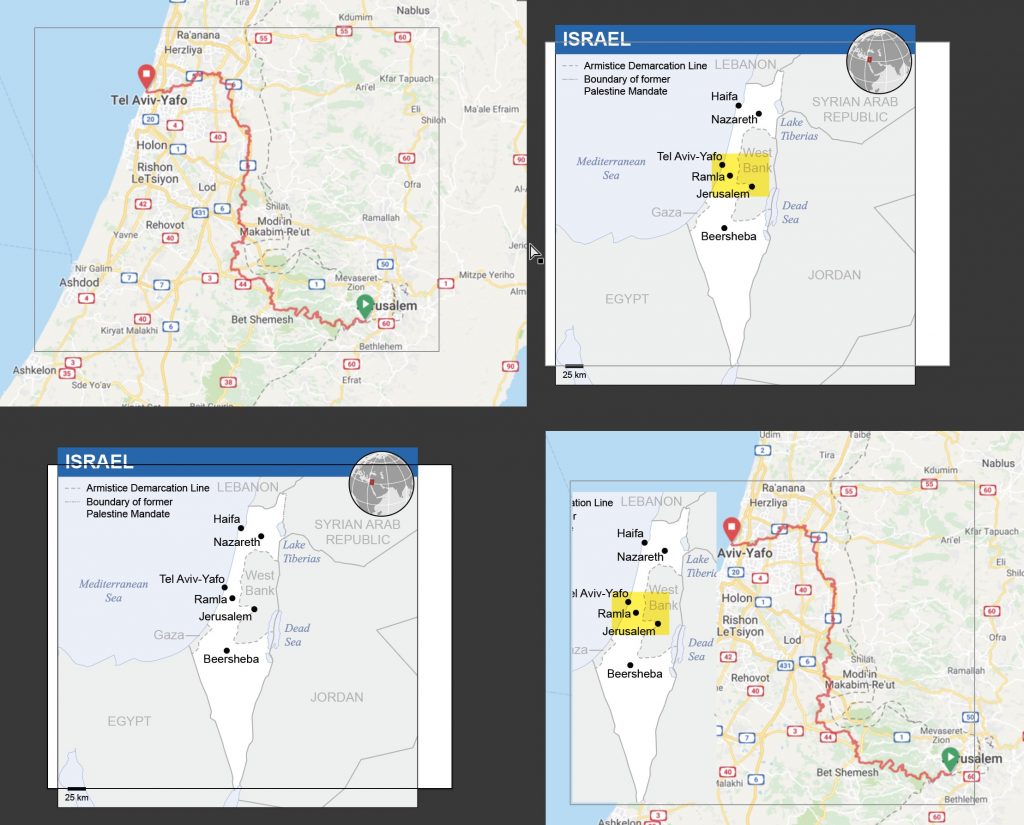
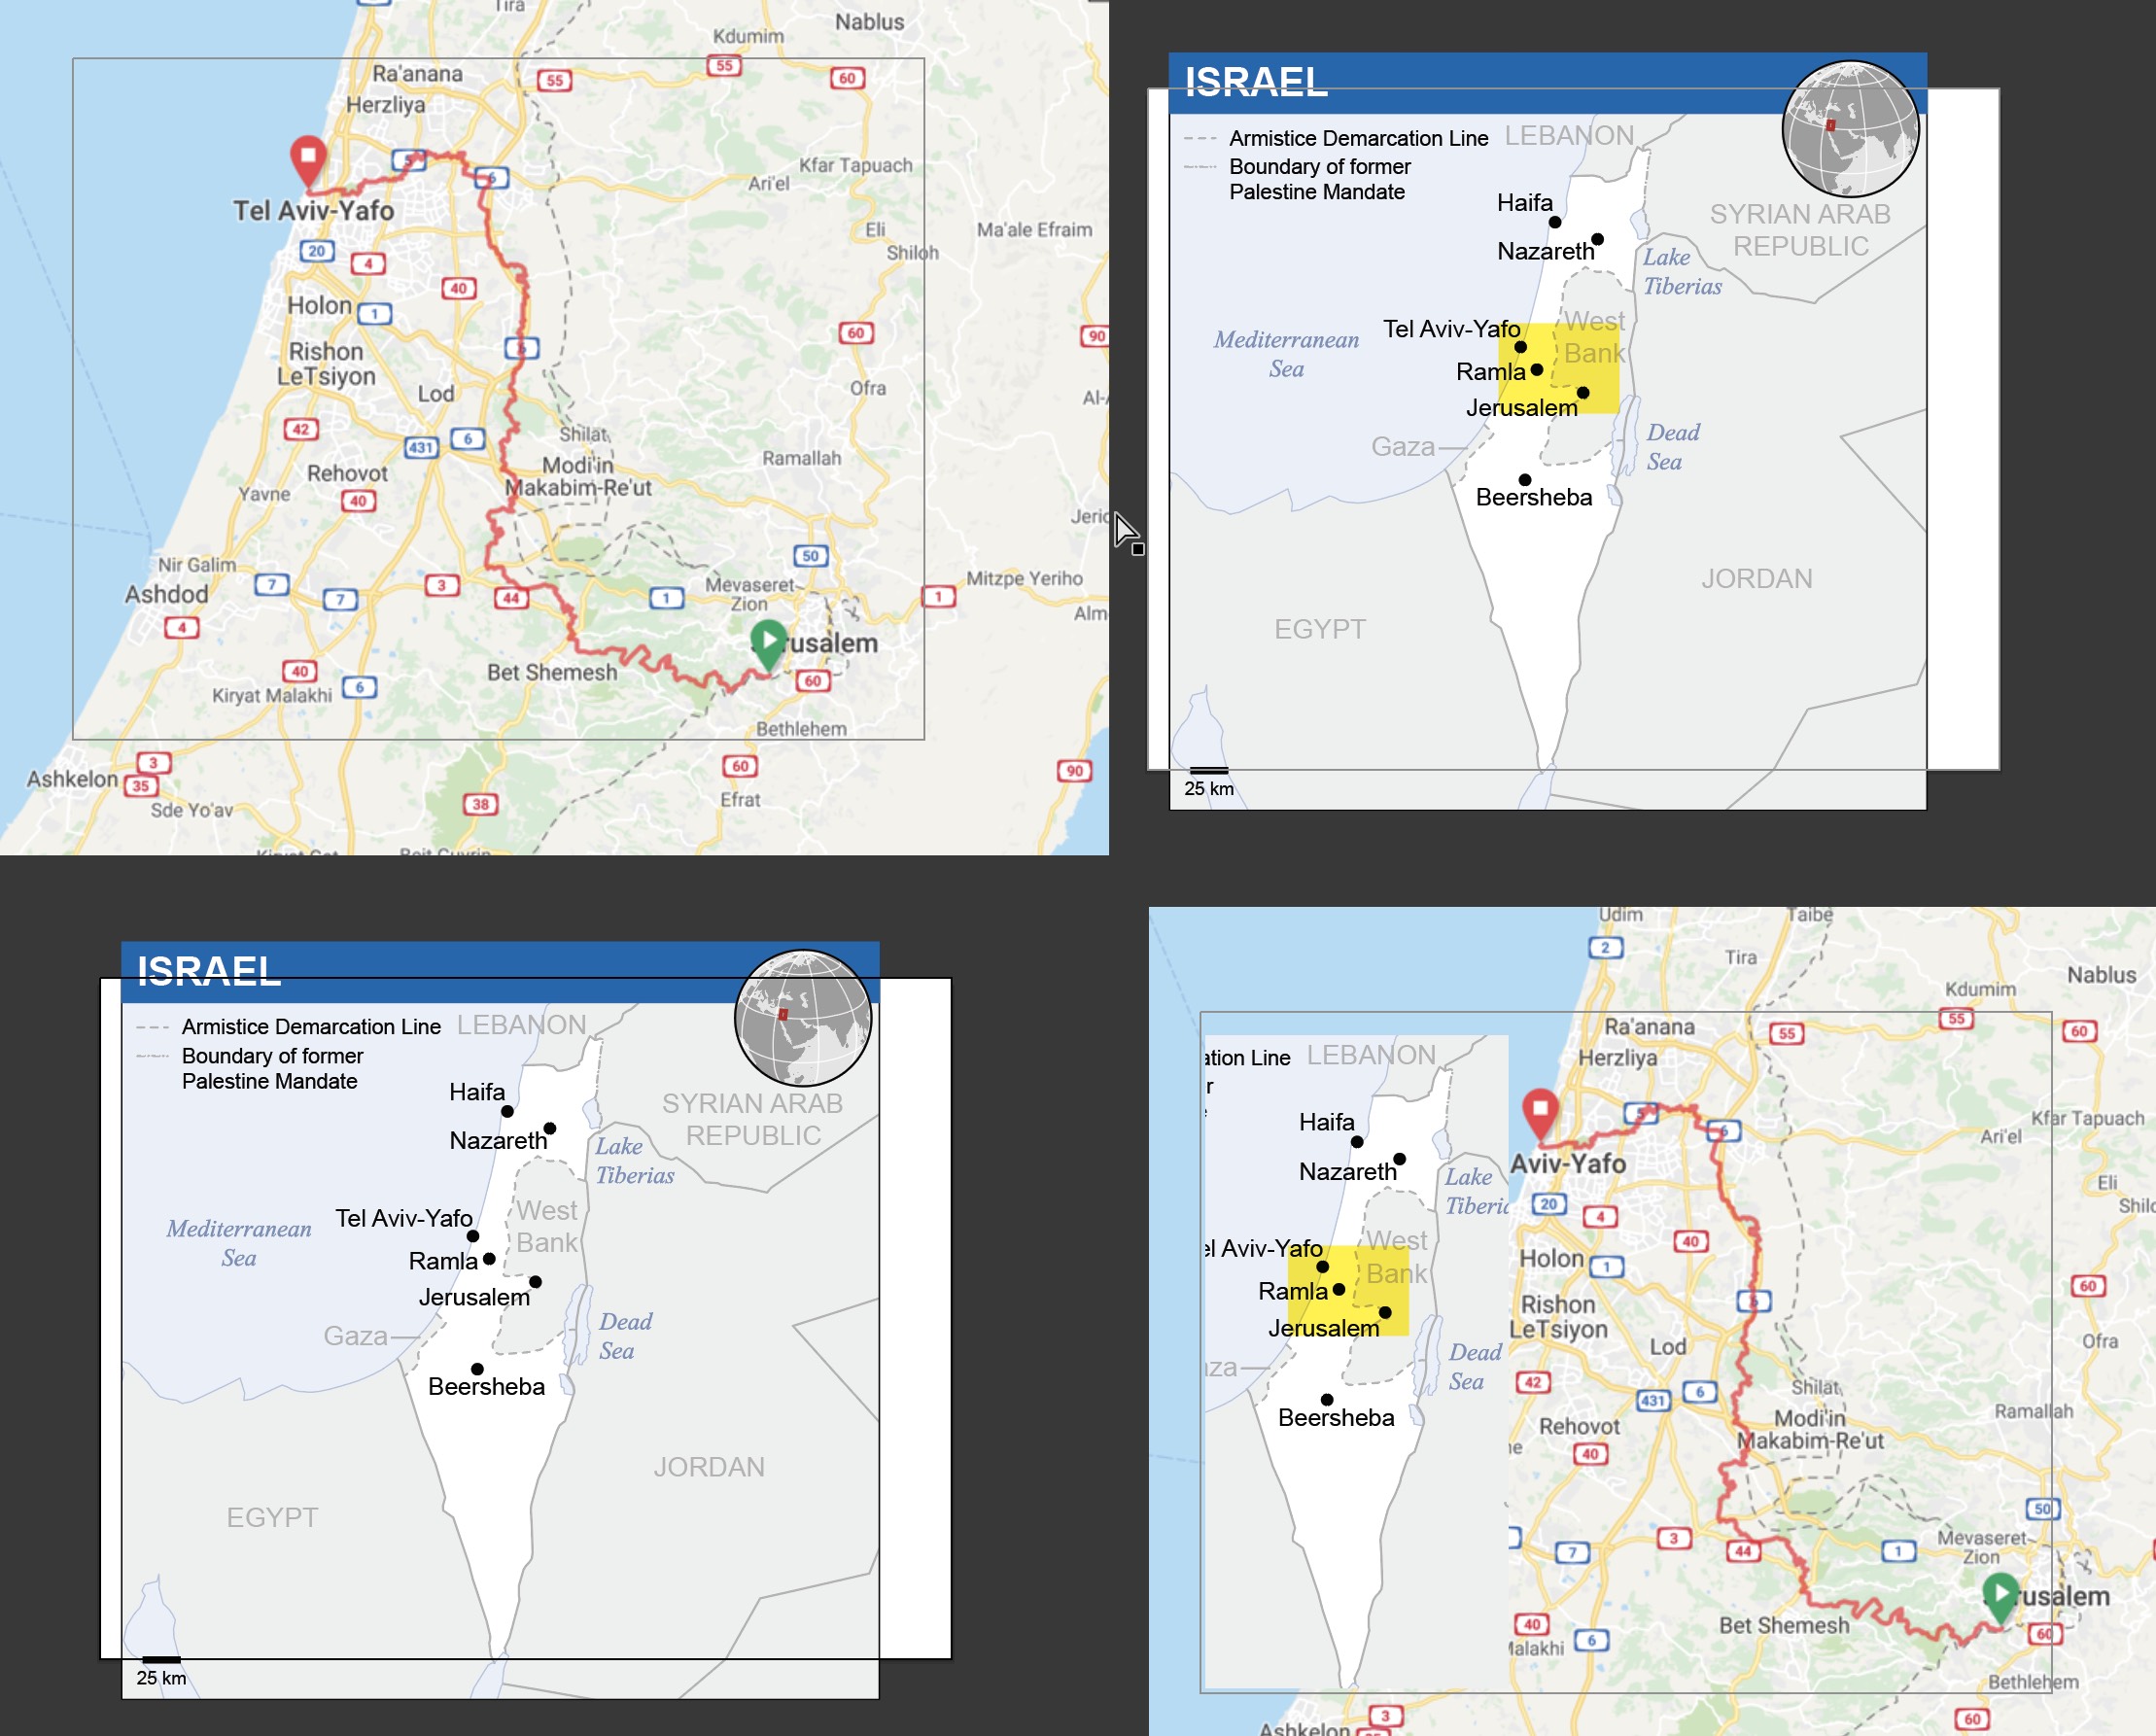
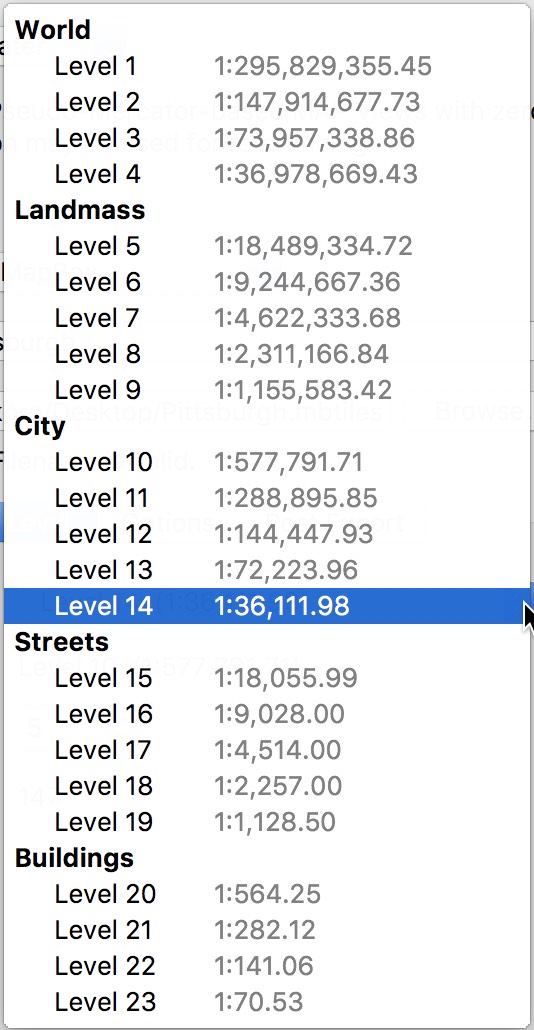
Looking at a google map, we can get a general sense for the scale by the zoom level of the google or OSM map. For example, in the image below, I had a 5"x4" area for a map. I referenced google and a map from wikipedia. The final map will be different as it is revised, but this is a start.
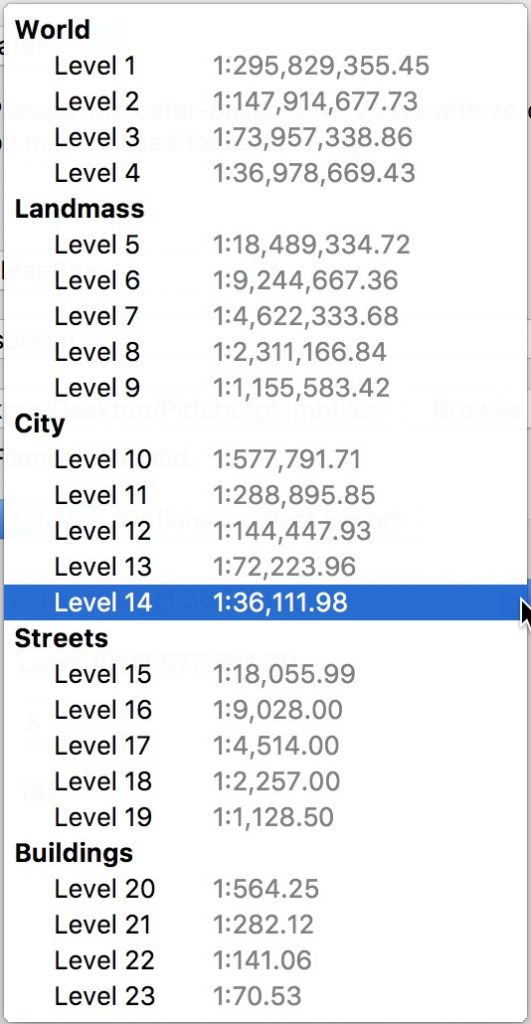
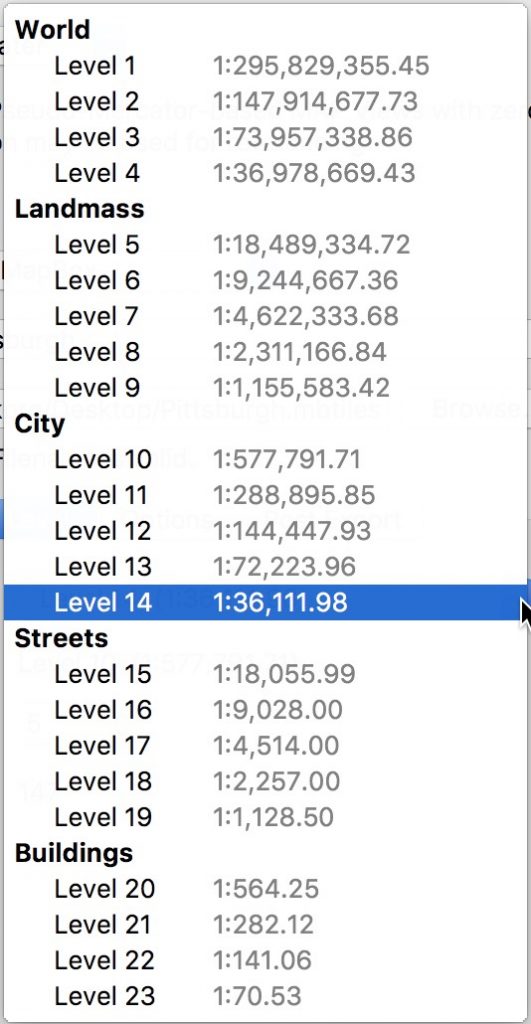
mocking up mapAvenza produces a cartographic/gis plugin suite for Adobe Illustrator called MAPublisher. I use MAPublisher on a daily basis. If you wish to purchase a student version that isn't upgradable, let me know. Here is a screen shot from MAPublisher that shows how Web Mercator map tiles relate to numeric scales.
Select data and import
Choosing Vector Data - Quick approach
If scale is small 1:10 million, and boundaries don’t need precision, then try Natural Earth.
If location is in US, and there’s an emphasis on boundaries, then try TIGER data or state data.
If location is County or Municipal level, then try county websites or contact the GIS staff person. Sometimes data exported as a geo pdf from ArcGIS can serve as data (still may need permission to use).
If you want to use Open Data, then try Open Street Map
Raster Data
For quick small scale global shaded relief, try Natural Earth.For high res data for an area, try SRTM or possibly LIDAR. Typical horizontal resolutions are
10 meter
90 meter
600 meter (30 arc seconds)
Set project projection
Set the project projection
Create a spatial bookmark for your desired scale
Organize data
Don’t rely on unsaved downloaded Quick OSM data.
Crop data to area needed and save to a SpatiaLite database. This is more organized than using shape files.
Set Composer window
Create new composer
Set composer page size ( Use points for consistency. 72 points = 1 inch)
Import map
Set scale. It’s helpful to keep the Map View Scale and Composer Scale the same (or similar).
Add a scale bar if you want.
Lock the Map Items.
Manipulate data
This is where you’ll perform joins and queries.
Stylize Map
This can be done manually or by using existing styles.Styles will likely involve queries.
Export
Export the map from Composer as both a PDF and an SVG, making sure that these are not rasterized and that the text is not outlined. The map may be nearly complete and need to be finished in Adobe Illustrator, Inkscape or Affinity Designer. We will use Illustrator.
In Illustrator
Text adjustment/placementAdditional graphic stylesAnnotationsIntegrate with other maps and graphics
Project
Resources
This file contains the files needed for the Week One Map.