Accessing Pennsylvania contours from PostGIS (on a Mac)
This video demonstrates how I access contours for Pennsylvania topography from a PostGIS database in both MAPublisher and QGIS, Compiling the data took an hour to setup, but it’s a good time saver. I discussed setting up PostGIS and Postgres on a Mac in a previous post.
Downloading data
Data originally comes from apps.nationalmap.gov, and the video shows what I downloaded. Going to apps.nationamap.gov instead of just nationalmap.gov saves time.
Processing the data
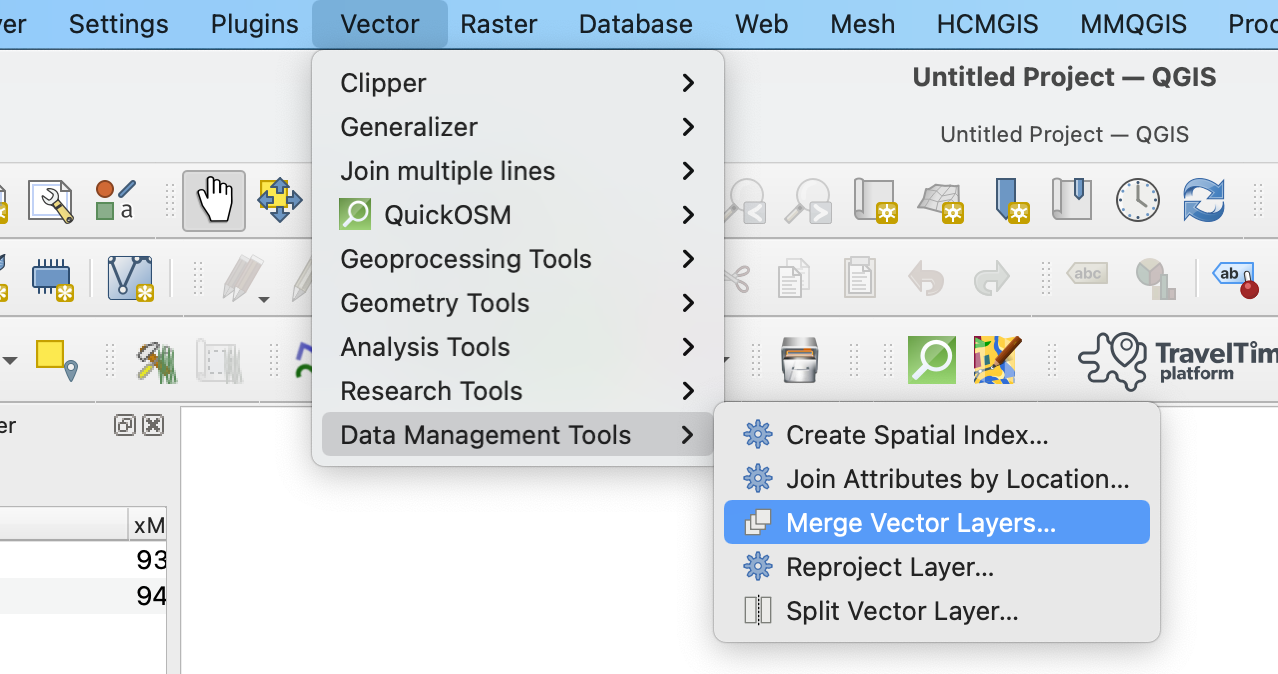
I downloaded and merged 28 shapefiles between 100 and 200+ mb in QGIS using
Vector -> Data Management Tools -> Merge layers.
The results are saved into an existing PostGIS database.
Data needs to be indexed so it doesn’t take forever to load. In the Database manager (database info tab), there was an option to create an index. It’s nice that QGIS does this in the DB Manager.
Styling data
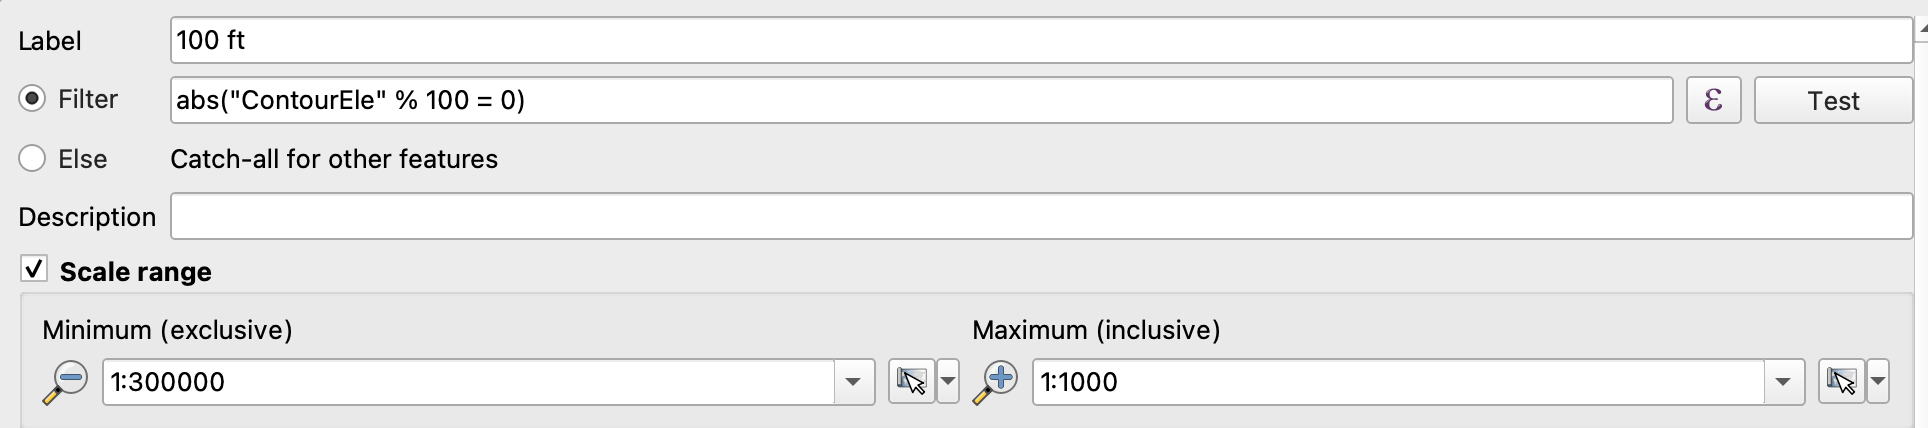
In the styles for the layer, I divided the contours into two groups, 100 ft intervals and other.
Contours of 100 ft intervals show up at a scale between 1:62,000 and 1:300,000. All contours show up when the scale is 1:62,000 or greater (to 1:1000). These are styled as well (.5 pt for 100 ft intervals, and .25 pt for 10 foot intervals). The styles for the layer are saved directly into the PostGIS database.
I think it’s important to set the styles like this so that I’m not trying to load too much useless data at once.
Opening the data in MAPublisher/Illustrator
Before opening the spatial database, I create a layer of the extents that I want to use (For example: Lewistown Area). The PostGIS data could then be cropped to Lewistown Area. The image below shows selecting the database, the tables, and the area to filter.
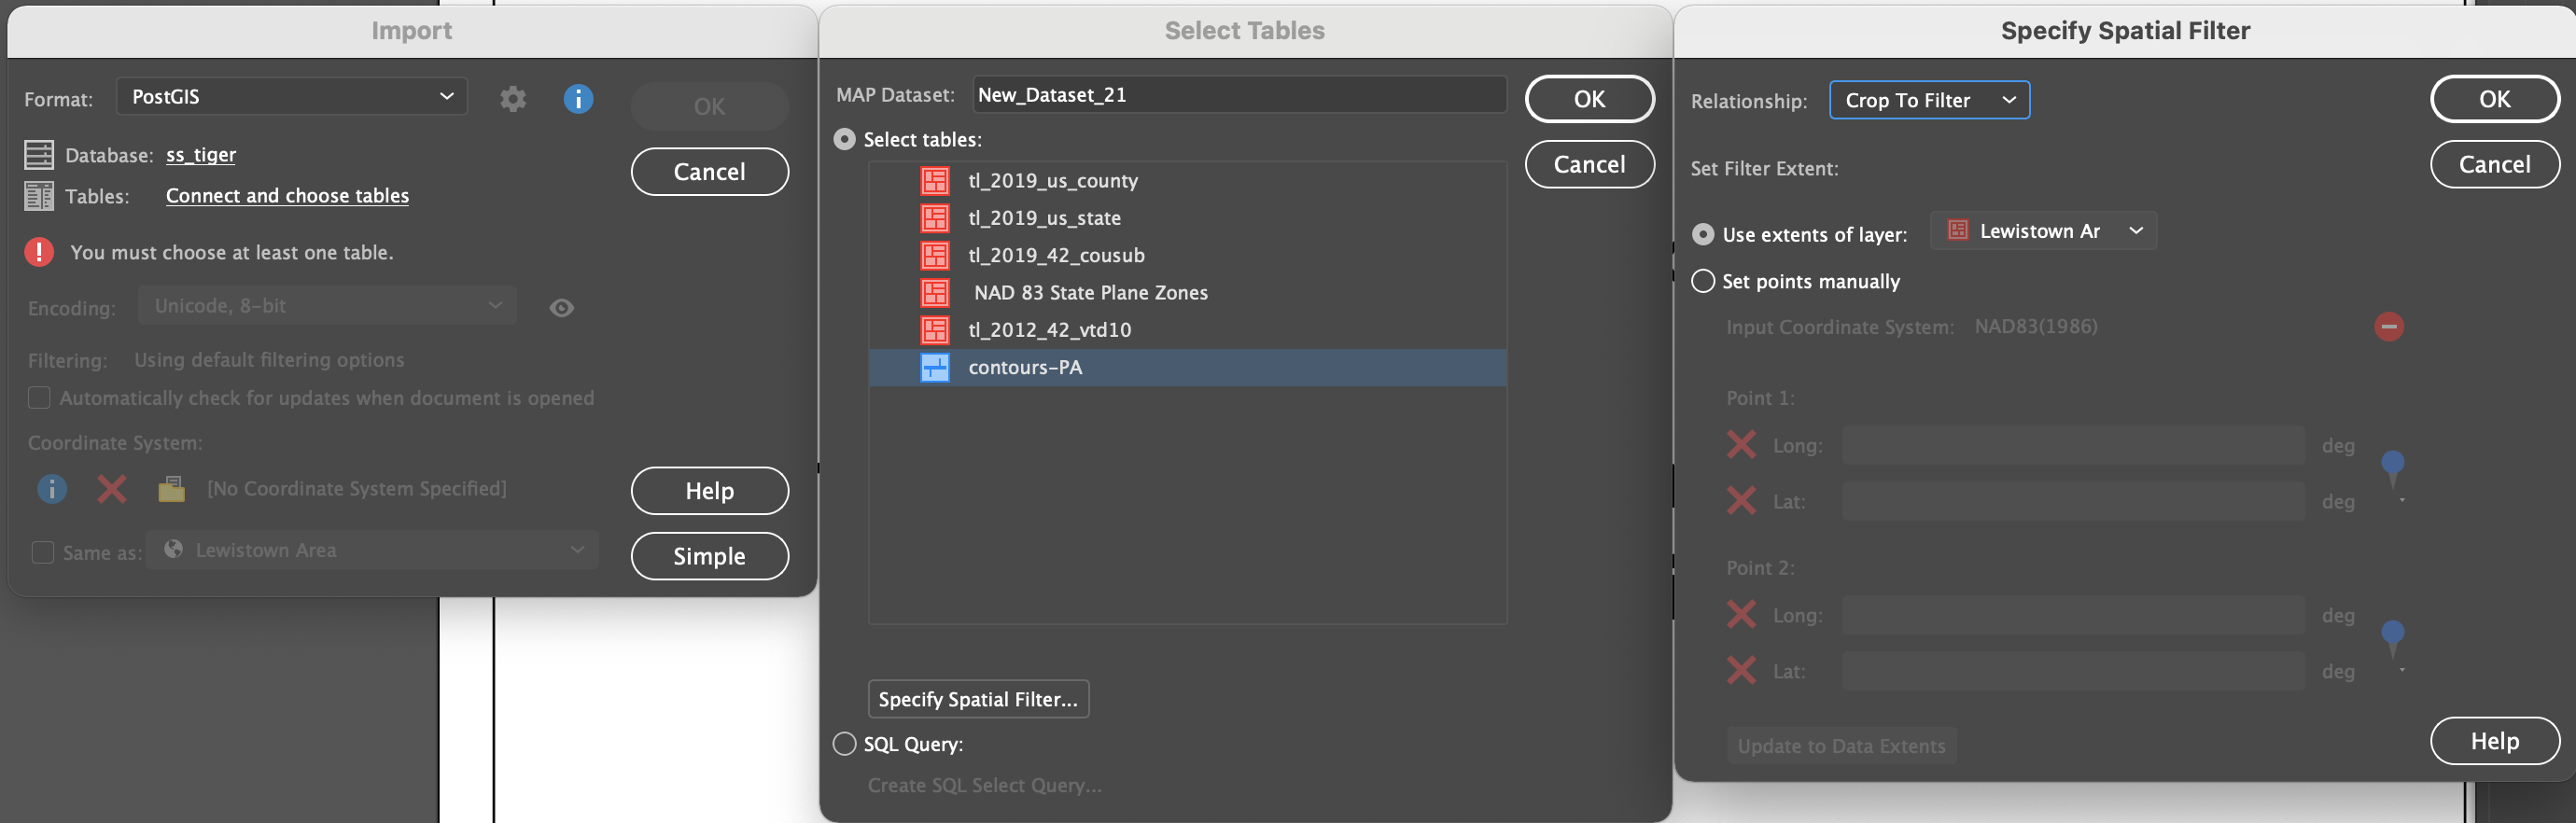
I could also have used a spatial query to select desired elevation intervals in a similar way that these were selected in QGIS. I think it should be possible to simplify and reproject the geometry on import, but I’m not sure.
Once the data is imported
Simplify and reproject the data.
Things to avoid
Importing data that you don’t need just takes more time. Going through the process of downloading a couple of gigabytes of data takes time. By using the PostGIS database, the same data can be used on both QGIS and Adobe Illustrator with MAPublisher.
To sum things up
There are three reasons I like using PostGIS. I always know where to find a dataset. It’s faster than than data in a file (such as geojson), and it works with both MAPublisher/Illustrator and QGIS. If you have questions, feel free to ask.
With regards to contour width, I think that a line thinner than .25 pt is probably the minimum width I’d want to use. The 100 ft interval would probably be better (i.e. offer more contrast to the other contours) at .75 pt. instead of .5.