Terrain Notes for Tompkins County
I want the Tompkins County bike map to highlight valleys and hills. The previous version used a combination of relief, contour lines and chevrons to indicate terrain, but it doesn’t work for me.
The 2o16 map prioritized municipalities, then topographic information (relief, contours, and slope chevrons).
The 2018 version could combine relief and hypsography to highlight valleys and hills. We can still show municipalities with less definition. Here’s the base from 2016 on the left compared to the one I’ve been working on today.
Old/Current versions - Slide the white bar to compare


Last week I created videos about creating shaded relief in both Natural Scene Designer and QGIS. Then, I reworked the relief in photoshop to give it a watercolor effect. The watercolor produced an interesting effect, but it wasn’t what I wanted.
Here’s the hypsometric version from QGIS on the left compared to the watercolor version on the right.


Data
10 Meter data from the Natural Scene Designer DVDs is the easiest to use. Natural Scene Designer has 30 and 90 Meter data for other parts of the world.
Data from the National Map Viewer works well. It just needs to be downloaded, and each area image is about 350 MB. It’s not a fast download. I find that the best link to use is viewer.nationalmap.gov/basic.
The data must to be converted to a metric projection. In this case NY State Plane Central, NAD 83 meters.
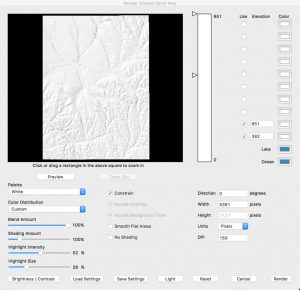
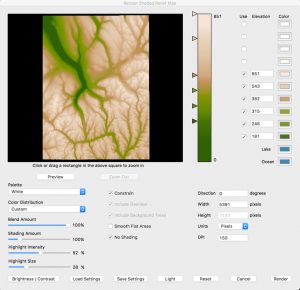
Settings in NSD
Here’s a zipped file of settings for the following images.
Placement into Illustrator
I used the place image menu option to place three images into Illustrator and registered them to NY State Plane Central, NAD 83 meters using MAPublisher. There I could manage them individually: One image was the shaded relief. The other was the colorized hypsography. And a third was grayscale tint.
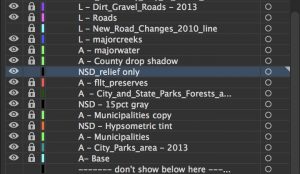
Here are the layers.
- Relief only (opacity: multiply)
- Areas and boundaries, such as parks
- municipality boundaries (inner glow, opacity multiply)
- 15% gray hypsometric tint from NSD (opacity: saturation, 50% – this doesn’t change much)
- Municipality area colors
- NSD Hypsometric tint (opacity: normal, 42%)
At the moment, I like the result because it has a hint of the greens and browns, conveying the message without dominating the map. With this transparency, the county municipalities still show up. In a few days I may change my mind.
What it should look like

Credits/Influence
Designing Better Maps (kindle edition) – Cynthia Brewer, Figure 2.9 talks about color ramps
ShadedRelief.com – Tom Patterson