A world locator map in 5 minutes using QGIS
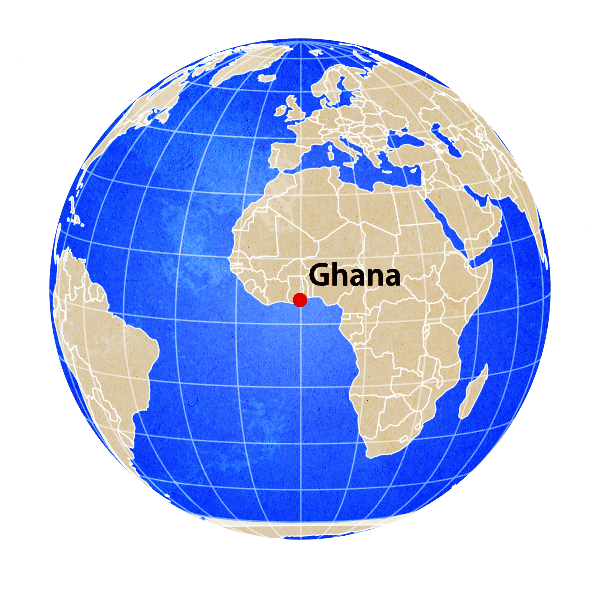
A small locator map is fun to make and useful when you want to direct someone’s attention to a place in the world that you are trying to describe. It uses an orthographic projection,which looks like you are looking at the earth from a distance.
To make this, you’ll need QGIS and some data from naturalearthdata.com. I’ve provided a zipped file that can save lots of time.
Not covered, but helpful
QGIS has a Processing Toolbox, which is a list of scripts. I split the graticules (the grid marking 15 degrees distances on the map) into line segments to remove horizontal lines that would otherwise show up when you use the data directly from naturalearthdata.com. The script used is Split with Lines.
And I saved the data and styles to a geopackage file using the Package Layers Processing Toolbox Script. This is an incredible way to keep your data organized.
I used less detailed data (110 million scale) for the map because you don’t need much detail for a map that’s generally less than 2″ in diameter. And the data renders faster too.
While I used a point, you could also use a polygon to locate the area on the map. I used a plugin called geocoding that can be downloaded through the plugins menu option.
Finally, if you look at the southern area of the map, you can see that Antarctic is not very well formed. This could be cleaned up by splitting the polygon into a couple different polygons. Or you could just leave it off the map.
Orthographic Map Recipe
In the zipped file, you’ll find the following:
- ortho_110.gpkg
- ortho_110.qml – this is a style for the point and text placed to highlight a feature.
- a readme.text that is similar to this post
- a pdf of the finished map.
Steps
- Download the zipped file and drag the geopackage onto a new QGIS project. You can select and add all of the layers, though the top geocoding layer isn’t really needed
-
Create a new orthographic projection in Settings->Custom Projections . I copy the lat/lon from google maps like in the video and replace the numbers bolded here.
+proj=ortho +lat_0=49.2 +lon_0=-123 +x_0=0 +y_0=0 +a=6371000 +b=6371000 +units=m +no_defs
-
Reproject the project to the new ortho projection. This can be done in Project Properties -> Coordinate Reference System (CRS). You might just search for the new projection name that you created.
-
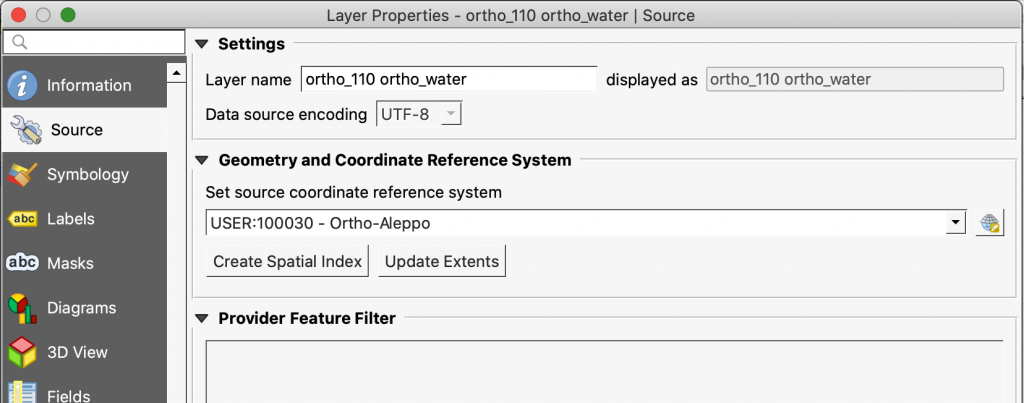
Reproject the water layer to the new ortho projection. This is done by double clicking the water layer and setting the CRS in the Source. To the right of the CRS text box, there’s a little projection icon. That’s what you want to use to find your new projection.
6. Use the Geocoding plugin to add a center point to the map
7. Use the enclosed qml style to set the point style and text
8. Edit the point field to ‘The location name’. I find this easier than using a data generated field name in this instance.
9. Set up the print layout
The style is meant to work with a 2” square print layout.
The scale for the map is 300,000,00010. Export as a pdf

Summary, next steps
This isn’t the only way to make a locator map. You could also use a raster image from naturalearthdata for a different effect. And I’ve made a video that goes over how to make an orthographic map in MAPublisher/Illustrator.
By the way, you can easily give a map more texture. In the map below, I opened the pdf in Affinity Photo and added a couple of textures, paper and ocean. I think these make the map look more compelling.